
Madras Agricultural Journal
Loading.. Please wait

No figure image available.

No figure image available.

No figure image available.

No table image available.

No table image available.

No table image available.

Research Article | Open Access | Peer Review

Farmers Perception Towards Branded Crop Protection Chemicals (CPC) in Tamil Nadu

Nandhini Kannan ORCID iD , Balaji Parasuraman ORCID iD , Mugilan Kannan ORCID iD
Volume : 112
Issue: September(7-9)
Pages: 23 - 30
Download

No figure image available.

No figure image available.

No figure image available.

No table image available.

No table image available.

No table image available.

Abstract


Crop protection chemicals, commonly known as pesticides, are essential agricultural inputs designed to safeguard crops from threats like weeds (herbicides), insect pests (insecticides), and plant diseases (fungicides/bactericides). These chemicals are crucial for maintaining yield and quality in agricultural production. Pesticide consumption has shown fluctuations over the past two decades both at the national and state levels in India, particularly in Tamil Nadu. This fluctuation is due to the influence of some factors among the farmers. Hence, this research focuses on the significant factors affecting farmers preferences and perceptions towards branded crop protection chemical products in Tamil Nadu, India. A total of 100 farmers were surveyed using a purposive sampling method with well-structured questionnaires in the northern & western parts of Tamil Nadu. Factor analysis was employed for analysis, and four primary factors were identified, accounting for 81.659% of the total variance. “Product trust & effectiveness” (42.44%) was the most influential component, followed by “brand perception & loyalty” (16.68%), “accessibility and value” (11.87%), and “influence & responsibility” (10.65%). These four factors reveal how well products perform, value for money, the importance of easily available products, dealer recommendations, and concerns about environmental safety, which are all influencing the farmers' perception towards crop protection chemicals. The insights offer actionable recommendations for firms to enhance trust, brand loyalty, accessibility, and sustainability efforts, thereby increasing farmer satisfaction

DOI
Pages
23 - 30
Creative Commons
Copyright
© The Author(s), 2026. Published by Madras Agricultural Students' Union in Madras Agricultural Journal (MAJ). This is an Open Access article, distributed under the terms of the Creative Commons Attribution 4.0 License (https://creativecommons.org/licenses/by/4.0), which permits unrestricted use, distribution and reproduction in any medium, provided the original work is properly cited by the user.

Keywords


Crop protection chemicals Attitude Perception and Factor analysis

Introduction


Crop protection chemicals broadly referred to as pesticides, are a vital class of chemical substances used in agriculture to safeguard crops from various threats that can significantly reduce yield and quality. These threats primarily include weeds, insect pests, and plant diseases caused by fungi, bacteria, and viruses. The main categories of crop protection chemicals include herbicides, which are used to control unwanted plants (weeds) that compete with crops for sunlight, water, nutrients, and space. Insecticides are designed to kill or repel insect pests that feed on or damage crops. Fungicides/Bactericides are employed to prevent or control plant diseases caused by fungi and bacteria. According to the Food and Agriculture Organization (FAO), the total global use of pesticides in agriculture was approximately 3.70 million tonnes of active ingredients in the year 2022. This represents a 4% increase compared to 2021. The global average usage of crop protection chemicals reached 117.9 kg per hectare in 2022. Fungicides had the highest per-hectare consumption at 48.4 kg, followed by herbicides at 44.8 kg per hectare in the same year. However, the overall consumption of pesticides in India for recent years, from 2018-2019 to 2023-2024, shows fluctuations, with a decline or stagnation from this peak. Consumption fell in 2018-2019 and again in 2022-2023 to 53.63 tonnes, despite some recovery in 2019-2020 at 61.7 tonnes and 2020-2021 at 62.19 tonnes (source: Indiastat).  Nearly seven percent of the cost was spent on crop protection chemicals (Balaji et al., 2018). Additionally, a study by Janaki Rani et al. revealed a similar decline in the consumption pattern of pesticides among farmers in India. The latest data for 2023-2024 indicates consumption at 55.24 tonnes, which is below the recent peak levels shown in Figure 1.  Overall, while there have been periods of growth, total pesticide consumption has not consistently increased throughout the entire observation period, with recent figures lower than the highest levels reached. The average consumption over the 24 years is about 52.07 tonnes. The consumption pattern in Tamil Nadu over this decade shows significant volatility. It's not a consistent upward or downward trend, but rather a pattern of stability followed by a decline, a strong recovery, and then another period of decline and slight recovery, as shown in Figure 2. The consumption in 2023-2024 (1970 tonnes) is lower than the initial figures (around 2096 tonnes) and significantly below the peak of 2225 tonnes in 2019-2020 (Janaki Rani et.al., 2025). This indicates a general stagnation or slight decline in recent years compared to the start of this specific period. These fluctuations indicate that the consumption of crop protection chemicals will vary among farmers over the specified period.

Methodology


Janaki Rani et al., (2025) stated that Pesticide consumption patterns vary due to diverse farmer perceptions, which are shaped by factors such as cultural values, beliefs, attitudes, education, societal influences, and relevant laws and regulations. Balaji P et al., (2022), found that farmers' buying behavior, including their preference towards products, dealer characteristics, and consultancy, were the most critical parameters influencing the purchase. The farmers' choice of pesticides mainly depends on dealer influence with other factors including price, experience, availability, and brand image (Manda Harish et al., 2023). Recent studies across various regions highlight the complex factors affecting farmers' pesticide choices. Some research in India identifies that dealer influence, price, experience, brand image, advertising, social factors, and product availability are key drivers of farmers' brand preferences and purchasing decisions. Kachroo et al., (2023) described that the effective control and efficacy of the pesticide mainly were influencing farmers' purchase decision in Jammu & Kashmir. They also considered the price of the product. Oganja et al., (2024) identified six factors that significantly influenced farmers' intentions to purchase insecticides. These factors are product performance, financial support, product specifications, influence from the sales team, feedback, and social influence. Praveen et al., (2020) in their study showed that most farmers were very satisfied, followed by those who were moderately satisfied, with the quality of the herbicide. Additionally, they were satisfied with the price, brand image, availability, and effectiveness of the herbicide in the study area. These factors guide agricultural input companies in product development and marketing.

At the same time, studies from Sri Lanka Malaysia, Indonesia, Pakistan, and Ethiopia consistently reveal significant gaps in farmers' knowledge, perceptions, and safety practices regarding pesticide use. There is a gap between farmers' reliance on insecticides and their basic understanding of safe handling practices. This situation is causing unsustainable farming methods and significant risks (Bakhtawer, 2021; Ocho et al., 2016). Effendy et al., (2021) explored how farmers' choices to use pesticides for controlling weeds, pests, and diseases in lowland rice were greatly influenced by their gender, age, education level, access to extension services, farming experience, and access to credit. Selvarajah and Thiruchelvam, (2007) highlighted the urgent need for better awareness and training on the safe use of pesticides for sustainable agriculture. Gamage et al, (2022) revealed that marketers should focus on improving farmers' experiences through demonstrations and media exposure. This can help change their attitudes toward buying pesticides. These studies often highlight indiscriminate application, improper storage and disposal, low educational levels, lack of formal training, and insufficient awareness of health and environmental risks.  Hence, the main problem is that diversified factors interplay with farmers' perceptions of various branded crop protection chemicals, which is the most confusing one for pesticide industries to frame their marketing strategies towards. This research paper aims to analyze the key drivers of farmers' perceptions towards various crop protection products, using a study conducted in 2025 specifically in the western & northern parts of Tamil Nadu.


Figure 1. Consumption of pesticides in India (in MT) (Source: Indiastat)


Figure 2. Consumption of pesticides in Tamil Nadu (in MT)

Materials and Methods

      The research was conducted in the north & west parts of Tamil Nadu, which include Salem (16 farmers), Dharmapuri (40 farmers), Krishnagiri (12 farmers), Hosur (9 farmers), Vellore (8 farmers), and Kanchipuram (15 farmers) during the year 2025. Major crops grown in these districts include maize, cotton, groundnut, banana, tomato, brinjal, chilli, paddy, onion, gourds, mango, coconut, jasmine, musk melon, capsicum, rose, radish, cucumber, gerbera, chrysanthemum, marigold, and cauliflower. The farmers in this region are mostly following the mono-cropping pattern. This region was purposively selected because it had diversified crop growers, a mix of crops, and different agro-climatic conditions. In this research, 100 farmers were surveyed using a purposive sampling method with the structured questionnaires to collect the data. Factor analysis was used to analyze the collected data across northern Tamil Nadu, encompassing several variables. The factor analysis model is:

X = μ + L F + e

X - p*1 vector of measurements

μ - p*1 vector of means

L - p * m matrix of loadings

F - m*1 vector of common factors

e - p*1 vector of residuals


Table 1. Variables for farmer preference towards Crop protection chemicals

S. No.

Variables

1.

Brand preference

2.

Effective pest and disease control

3.

Brand engagement

4.

Satisfaction with quality and performance

5.

Reliability and trust in the brand

6.

Dealer influence

7.

Environmental safety

8.

Product availability and accessibility

9.

Value for money

10.

Product efficacy


Results Discussion


Result and Discussion

This section presents the socioeconomic and demographic profiles of surveyed farmers and their influence on crop protection product purchases. It also covers data validation and key factors influencing farmer attitudes and satisfaction toward pesticide brands.

Socio-economic profile of farmers

Most farmers were between the ages of 41 and 55, and they earned between Rs. 200,000 and Rs. 400,000 annually.  The majority of the farmers were educated to a secondary level.  Nearly 26 percent of the farmers in the study area were small scale farmers. The demographic details of the respondents are presented in Fig. 3. We can determine that the purchase of branded, high-quality products was dependent on the farmers' revenue based on their earnings. Farmers' purchasing power will be impacted because agricultural revenue is seasonal.  When the market price of agricultural output was high, farmers would choose the more costly, branded, and high-quality products.


The Kaiser-Meyer-Olkin (KMO) value of 0.702 is considered good, as shown in Table 3. This confirms that the variables are well related and share a significant amount of common ground. Bartlett's Test of Sphericity provided further support for this. It showed a significant correlation among the variables (χ² = 667.896, p < 0.05). This indicates that factors such as product efficacy, quality, brand preference, and pricing are connected. They influence farmers overall attitudes and satisfaction. This statistical evidence helps researchers identify and understand the key factors that shape farmer perceptions. This insight is crucial for companies in the competitive crop protection market to develop more effective products and strategies.

Table 3. KMO and Barlett’s test of influencing factors

KMO and Bartlett’s Test

Kaise Meyer Olkin’s measure of sampling adequacy

0.702

Bartlett’s Test of Sphericity

Approximate Chi-Square

667.896

df

45

Significant

0.00


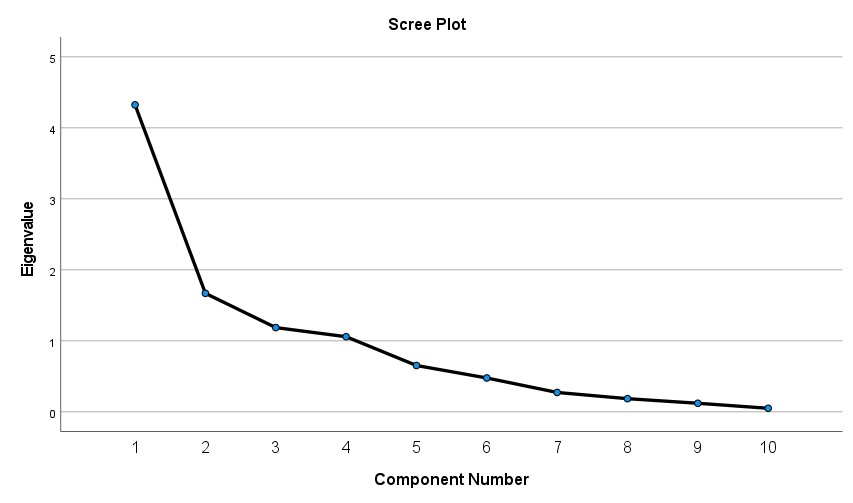
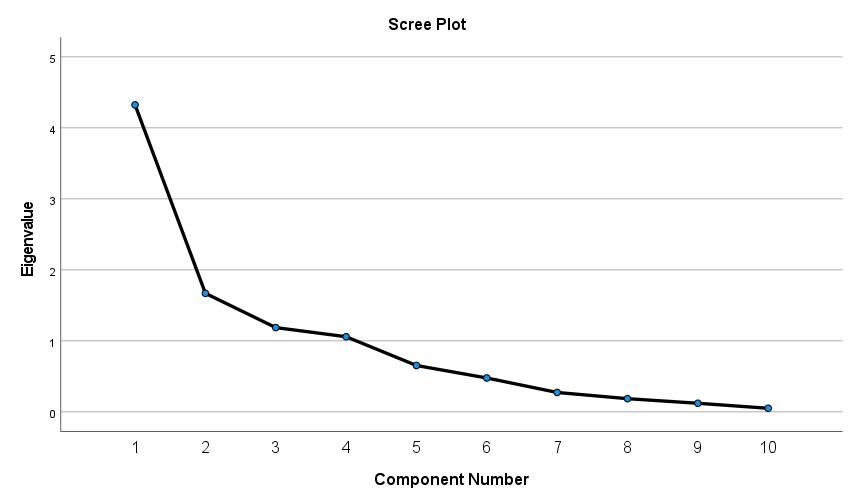
In factor analysis, communalities reveal how well the selected underlying factors explain each variable. A high communality indicates that the factor effectively represents the variable. For example, Brand Engagement had a communality value of 0.969, and Product Availability and Accessibility had a communality value of 0.895, indicating that the identified factors explain their variance well. In contrast, lower communalities, such as those for brand trust and reliability (0.653) and performance and quality satisfaction (0.666), suggest that these variables are also shaped by unique or unmeasured factors. This emphasizes that farmers' views on pesticide brands are complex. Understanding these differences enables stakeholders to refine their strategies for enhancing brand perception, trust, and product performance in the competitive pesticide market. The eigenvalues indicate the proportion of variance each factor explains. Following Kaiser's Criterion (eigenvalue > 1), we identified four critical components, as shown in Table 3. Together, these four components explain 81.659% of the total variance across the ten observed variables. Specifically, component 1 accounts for 42.44%, component 2 for 16.685%, component 3 for 11.87%, and component 4 for 10.65%. This high cumulative variance indicates that these four factors effectively capture the key information influencing farmers' attitudes toward pesticide brands, in Figure 4, which depicts the scree plot diagram of the factors with eigenvalues exceeding 1.

Table 3. Extracted principal components based on the eigenvalue criteria

Total variance explained

Components

Initial eigen values

Extraction Sum of Squared

Rotation Sum of Squares

Total

% of Variance

Cumulative %

Total

% of Variance

Cumulative %

Total

% of Variance

Cumulative %

1

4.324

43.244

43.244

4.324

43.244

43.244

2.569

25.694

25.694

2

1.669

16.695

59.939

1.669

16.695

59.939

1.998

19.979

45.673

3

1.187

11.870

71.809

1.187

11.870

71.809

1.874

18.744

64.417

4

1.058

10.585

82.393

1.058

10.585

82.393

1.798

17.976

82.292

5

0.653

6.532

88.925


6

0.477

4.772

93.697


7

0.273

2.733

96.430


8

0.186

1.857

98.287


9

0.121

1.210

99.497


10

0.050

0.503

100.00


The rotated factor loadings shown in Table 4 clarify the relationships between variables and the underlying factors identified in Principal Component Analysis. These loadings indicate the strength of each variable's connection to a factor. The rotation process groups similar variables, making it easier to understand and label the factors, such as "Product Trust & Effectiveness" or "Brand Perception & Loyalty." This method statistically validates the factors and provides valuable insights. It helps companies improve product development, branding, and distribution by focusing on what really affects farmers' views of pesticide brands.

Table 4. Rotation Component Matrix

Rotation Component Matrix


Components

1

2

3

4

Effective pest and disease control

0.823


Satisfaction with quality and performance

0.800


Product efficacy

0.759


Reliability and trust in the brand

0.744


Brand preference


0.956


Brand engagement


0.948


Product availability and accessibility


0.906


Value for money


0.891


Dealer influence


0.850

Environmental safety


0.842

Extraction method: Principal Component Analysis

a. Rotation converged in 5 interactions


            Factor analysis identified four main factors shown in Table 5 that influence farmers' pesticide brand choices such as Product Trust & Effectiveness with the highest variance of 42.44%, Brand Perception & Loyalty with the variance of 16.68%, Accessibility and Value which accounts for 11.87% of variance and Influence & Responsibility with the variance of 10.65%. Product Trust and Effectiveness emphasizes effective pest control, product quality, and brand reliability. Consistent performance builds trust and satisfaction among farmers. Brand Perception and Loyalty highlights the emotional attachment farmers have to specific brands. It shows that branding matters for loyalty extending beyond a product's technical performance. Accessibility and Value stresses the importance of easily available products and good value for money. These aspects strongly influence purchasing decisions, especially in rural areas. Influence and Responsibility reveals that dealer recommendations and concerns about environmental safety are significant factors influencing farmers' choices. Understanding these aspects enables agrochemical companies and policymakers to tailor their strategies to what farmers value most, ranging from performance to sustainability.

Table 5. Component naming

Components

Variance %

Factors Loadings

Product Trust & Effectiveness

43.24

Effective pest and disease control

Satisfaction with quality and performance

Product efficacy

Reliability and trust in the brand

Brand Perception & Loyalty

16.69

Brand preference

Brand engagement

Accessibility and Value

11.87

Product availability and accessibility

Value for money

Influence & Responsibility

10.58

Dealer influence

Environmental safety


Conclusion


Most of the sample respondents were middle-aged, ranging in age from 41 to 55 years old. They had a secondary education and earned Rs. 2 - 4 lakhs annually. Their ability to buy branded, high-quality products was directly linked to seasonal agricultural income. Their preferences shifted in response to market prices. Four main components were identified such as “product trust & effectiveness” (43.24), “brand perception & loyalty” (16.69), “accessibility and value” (11.87) and “influence and responsibility” (10.58) which explained 82.39% of the total variance, influencing farmers' perception towards branded plant protection chemicals. In summary, farmers' choices are complex.  Farmers’ agri input choices are influenced by a combination of product performance, brand attachment, accessibility, cost, and advisory support which aligns with the result of Jain and Rakesh (2023), who found that product attributes, economic factors, and external advice collectively shape Indian farmers' purchasing decisions. These findings help agrochemical firms and policymakers develop strategies that focus on farmers. Companies should align pricing with seasonal incomes, offer a diverse range of products, and communicate in clear, local languages that are suited to the farmers' educational levels. Emphasizing product value, ensuring optimal performance, and fostering strong dealer relationships can significantly enhance brand trust and loyalty.

References


1. Janaki Rani A, Kavitha B, Abirami S, Narmadha N, Murugan P, Sumathi E , Bama K. S, and Manimekalai R. 2025. Pesticide in Indian agriculture: Consumption pattern and farmers perception. Plant science today.12(2) https://doi.org/10.14719/pst.6210

2. Balaji Parasuraman, Kumar A, Singh P, Deepa N, Vidhyavathi A, Velavan C, Shantha Sheela M. 2022.Farmers’ buying behaviour of herbicides and preference towards weeding operations in Tamil Nadu. The Indian Journal of Agricultural Sciences. 92(10):1286-8. https://doi.org/10.56093/ijas.v92i10.127174

3. Oesterlund AH, Thomsen JF, Sekimpi DK, Maziina J, Racheal A, Jors E.2014. Pesticide knowledge, practice and attitude and how it affects the health of small-scale farmers in Uganda: a cross-sectional study. African health sciences. 14(2):420-33. https://doi.org/10.4314/ahs.v14i2.19

4. Oganja YH, Maheta HY, Kumar K, Bharodia CR. 2024. Factors influencing farmers purchase intention toward insecticides of Rajkot district, India. Arch. Curr. Res. Int.24(8):67-74. https://doi.org/10.9734/acri/2024/v24i8849

5. Kachroo J, Chalotra G, Singh SP, Hamid N. 2023.Factors influencing farmer’s buying behavior towards pesticides in Jammu and Kashmir (UT). SKUAST Journal of Research. 25(3):426-36. https://doi.org/10.5958/2349-297X.2023.00046.6

6. Gamage VL, Samarakoon SM, Malalage GS. 2022 Nov. The impact of pesticide sales promotion strategies on customer purchase intention. Sri Lanka Journal of Marketing. 11;8(2). https://doi.org/10.4038/sljmuok.v8i2.103

7. Bakhtawer & Afsheen S. A cross sectional survey of knowledge, attitude and practices related to the use of insecticides among farmers in industrial triangle of Punjab, Pakistan. 2021. PloS one.16(8): e0255454. https://doi.org/10.1371/journal.pone.0255454

8. Effendy, Antara, M., Muhardi, Pellokila, M.R. and Mulyo, J.H., 2021. Identification of factors affecting decisions to adopt pesticides at lowland rice farms in Indonesia.16(6):(717-723).

https://www.iieta.org/journals/ijdne/paper/10.18280/ijdne.160614

9. Batoa H, Limi MA, Hamzah A, Cahyono ED, Arimbawa P, Yusria WO and Gafaruddin A. 2019 External factors affecting lowland rice farmers’ use of chemical pesticides in Welala Village, Kolaka Timur Regency, Indonesia. Journal of Agricultural Extension. 23(2):80-89. https://doi.org10.4314/jae.v23i2.9

10. Ocho FL, Abdissa FM, Yadessa GB, Bekele AE. 2016 Smallholder farmers’ knowledge, perception and practice in pesticide use in South Western Ethiopia. Journal of Agriculture and Environment for International Development (JAEID). 22;110(2):307-323. https://doi.org/10.12895/jaeid.20162.484

11. Jain A, and Rakesh R. 2023. Farmer buying behaviour toward major agri-inputs-finding from Fazilka district of Punjab, Economic Affairs., 68(3):1373-1378. https://doi.org/10.46852/0424-2513.3.2023.3

Cite This Article


APA Style

Kannan, N., Parasuraman, B., & Kannan, M. (2025). Farmers perception towards branded crop protection chemicals (CPC) in Tamil Nadu. Madras Agricultural Journal. https://doi.org/10.29321/MAJ.10.700JE28

ACS Style

Kannan, N.; Parasuraman, B.; Kannan, M. Farmers Perception Towards Branded Crop Protection Chemicals (CPC) in Tamil Nadu. Madras Agric. J. 2025, https://doi.org/10.29321/MAJ.10.700JE28

AMA Style

Kannan N, Parasuraman B, Kannan M. Farmers perception towards branded crop protection chemicals (CPC) in Tamil Nadu. Madras Agricultural Journal. 2025. doi:10.29321/MAJ.10.700JE28

Author Information


text-align: left
" align="center">
line-height: 150%
font-family: ariel
mso-bidi-font-family: Arial
">Nandhini Kannan,Balaji Parasuraman,Mugilan Kannan


footer

© Madras Agricultural Journal. Website design – All rights reserved.